

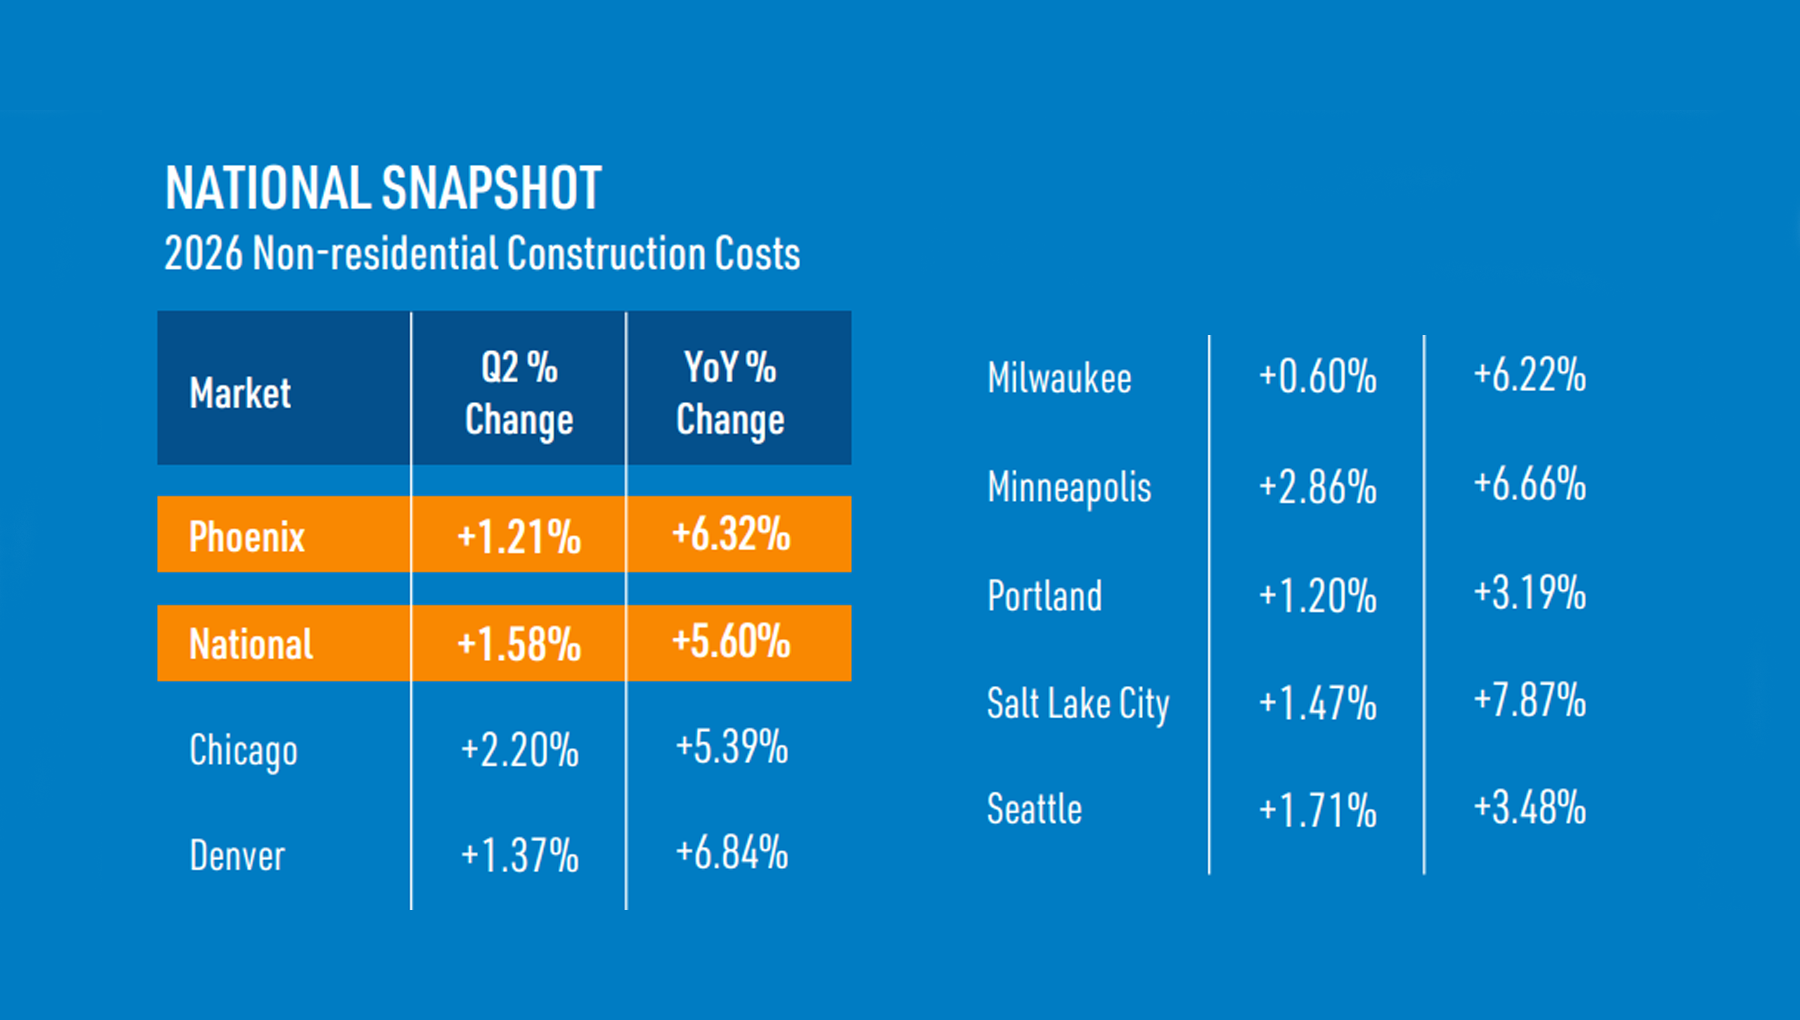

While Phoenix non-residential construction costs were less than the national average in terms of percent change in Q3, the metro found itself with a higher percent change for increases year-over-year.
According to the Construction Cost Index: 3rd Quarter 2026 recently released by Mortenson, national construction costs rose 1.58% over Q2’s figures and 5.60% YoY. Phoenix, however, saw a QoQ percent change of 1.21%, but a YoY percent change of 6.32%.
Other markets coming in higher YoY were Salt Lake City (7.87%), Denver (6.84%), Minneapolis (6.66%) and Milwaukee (6.84%).
For Q3 versus Q2, only Minneapolis (2.86%), Chicago (2.20%) and Seattle (1.71%) saw percent change increases greater than the national average.
Annually, Phoenix has been on par with or slightly greater than the national average for construction cost increases since 2010.
The current index identifies key U.S. cost drivers as mega project demand, existing union agreements, tariffs, energy costs and geopolitical disruption.
The national report says, “Mega-project investments remain the strongest source of upward pressure, while softer demand across portions of the commercial and institutional market continues to create competitive bidding opportunities as trade partners actively pursue available work.”
The Phoenix report identifies mega projects as the primary driver. According to Mortenson, “Mega-project investments remain the strongest source of upward pressure, while softer demand across portions of the commercial and institutional market continues to create competitive bidding opportunities as trade partners actively pursue available work.”
Labor availability was regarded as generally manageable in most markets, and Phoenix averaged 41,200 workers in the Bureau of Labor Statistics’ data for Construction of Buildings in the first half of 2026, up 4% over the same period in 2025.
Global supply chains have remained relatively stable, although electrical infrastructure is still among the most constrained categories, and tariff impacts are still evolving.
Metals and electrical systems lead scope increases, with electrical systems showing a quarterly increase of 3.4% and miscellaneous metal fabrication up 3.3%.
Cast-in-place concrete also experienced a 2% increase.
On the whole, “The Mortenson Construction Cost Index reflects conditions that remain steady but increasingly market specific. Data centers, grid infrastructure and advanced manufacturing continue to create localized pressure on labor, metals and electrical capacity, while conventional projects in markets without data center activity are seeing more aggressive scope bidding from trade partners.”