

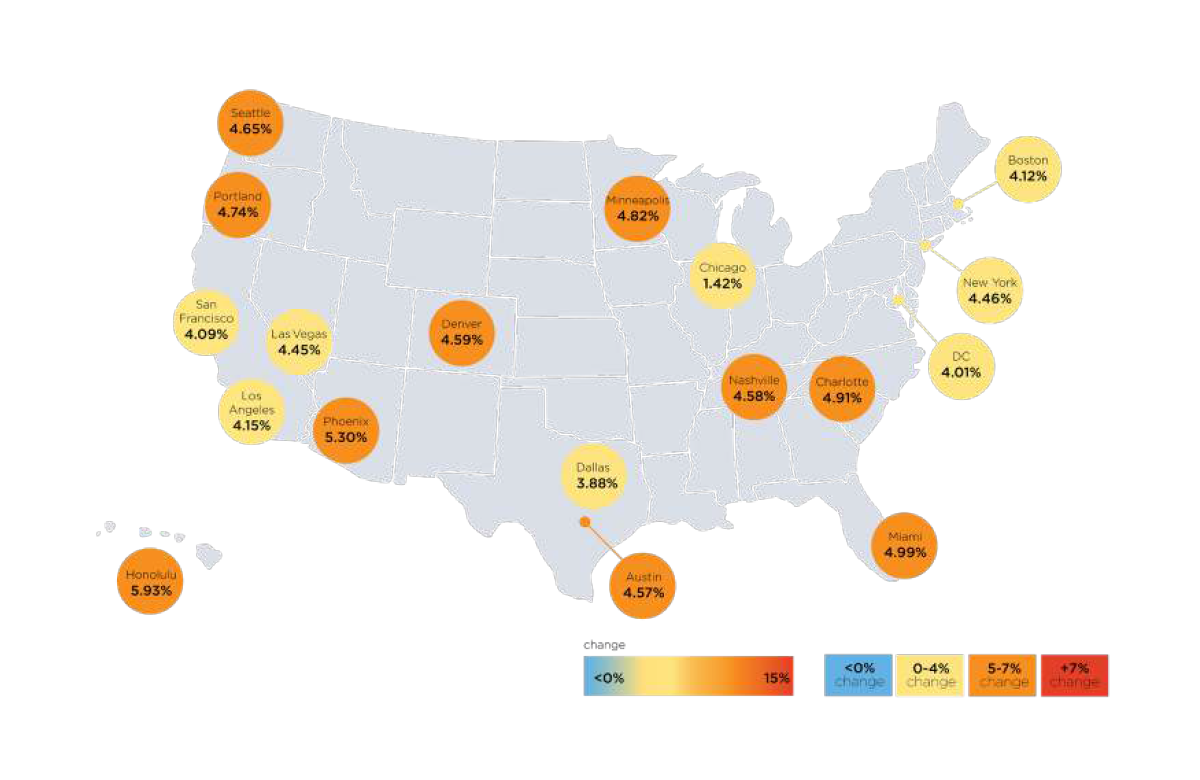

With a Q2 2026 percent change of 5.3%, Phoenix was, once again, among the metros reporting the greatest construction cost increases in Rider Levett Bucknall’s Q2 2026 Quarterly Construction Cost Report.
While the introduction to the Q1 Report described a market responding to inflation “leveling off,” according to RLB President North America Paul Brussow, the Q2 introduction looks at construction as having a “moment of adjustment.”
Brussow wrote, “Rather than a uniform shift across the board, current data reflects a healthy realignment of market activity. Specialized sectors continue to drive robust investment, with data centers, infrastructure developments, healthcare, and education showing exceptional strength. For example, a surge in data center projects has successfully boosted the national construction backlog indicator to 8.8 months, providing a solid, forward-looking runway of work for commercial and industrial contractors.”
The latest report examines market data through mid-Q2. The external data shows U.S. Gross Domestic Product increased around 1.25% in Q1, having taken a precipitous drop between Q3 and Q4 of 2025. The Consumer Price Index also trended upward, rising from around 324 in Q4 to 330.2 at the end of the Q2 study period.
The Architectural Billings Index nudged downward in April, having nearly reached 50 in March.
National unemployment was down slightly over the study period, but construction unemployment grew sharply, rising from around 4.2%-4.3% in Q4 2025 to approximately 6.25% over Q1.
RLB’s Construction Cost Index rose to 288.58 over the quarter, having been reported at 285.47 in Q1. Brussow reported, “Escalation continues to move closer to a consistent, manageable quarterly increase of approximately 1%; a pacing that offers developers a somewhat predictable environment for budgeting and long-term capital planning compared to the volatile spikes of the past few years. However, true predictability remains relative, as nothing is completely definite given the fluid nature of current global economics, geopolitical conflicts, and shifting tariff policies.”
Even though logistical and supply chain concerns warrant vigilant observation and contingency planning, contractors across companies of all sizes report high levels of confidence in the construction sector’s outlook.
Phoenix vs. Other Markets
RLB tracks annual percent changes in construction costs on a quarterly basis for 18 markets around the U.S. As of the April data reporting, the cumulative average for the group totaled 4.43. Phoenix had the second-highest percent change across the sample group at 5.3%. Phoenix was in the third position in Q1, up 5.12%.
The largest percent change over Q2 was in Honolulu, which came in at 5.93%.
Chicago had the smallest increase, by far, at 1.42%. The next lowest market was Dallas at 3.88%.