

By Rebekah Morris for AZBEX
Next month, the BEX research team will present detailed market analytics at the fourth annual Construction Forecast Event. The topic will be an exclusive and deep analysis of the next three years of the Arizona construction market. Below is a sneak peek:
How Much Construction Happens Each Year?
Annual construction volume in Arizona has been increasing by double-digit percentages year-over-year (Y–O–Y) since 2017. Prior to 2017, changes from year to year bumped around zero, averaging -1.88 percent between 2011 and 2016. For comparison, the average change in statewide construction volume Y–O–Y between 2008-2009-2010 was -29.91 percent. Since 2017 however, the industry has sustained a consistent and robust growth track.
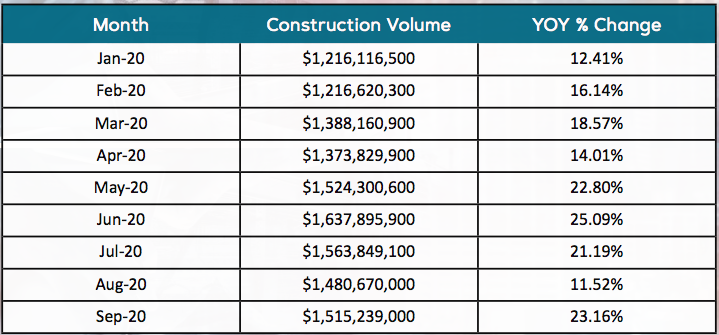
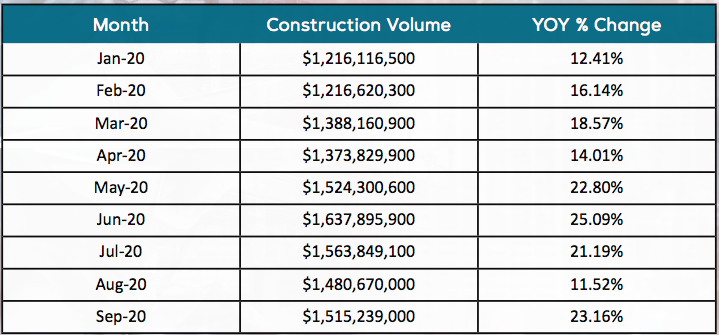
Statewide construction volume in 2020 is projected to top $17.56B, a Y–O–Y increase of 18.32 percent. Data from the Department of Revenue has released actual data through September of 2020, and each month has recorded double-digit Y–O–Y increases.
Impact of COVID-19 – Construction has been Spared
When the COVID-19 pandemic first started taking hold in March, a lot of uncertainty and angst was present in the market. Construction projects already underway were spared and the Governor’s distinction of construction as an essential activity left the industry largely unscathed.
The prolonged impact of the health pandemic combined with low mortgage interest rates has many people moving into new housing options, which has accelerated construction of housing (both multifamily and single-family) statewide.
The most significant negative impacts on construction due to COVID-19 are seen in hospitality and office. BEX projects a 20 percent Y–O–Y decline in construction of hospitality projects in 2021.
Sector by Sector Analysis – Calculating your Market Share
The annual Construction Forecast event goes beyond a macro-economic view of the industry, providing detailed and precise forecast data for individual market sectors including:
- Education – both Higher Ed & K–12
- Healthcare
- Hospitality
- Industrial (including Data Centers)
- Multifamily
- Office/Retail
- Power/Solar
- Public Spaces
- Transportation & Transit
BEX research starts with individual project-level data including the market sector, construction volume, Owner/Architect/Contractor information and the estimated construction start and finish dates. Using these key points of data for each individual project, BEX is able to create a forecast amount of construction volume for each individual market sector, and further identify the top players for each sector.
What is in it For You? Better Data. Better Plans.
What attendees’ value most from the forecast event is the hard analytics and top players information by market sector. Understanding how large the pie is to start enables individuals to better see how they can calculate their own market share for individual sectors, and more importantly, make business plans based on objective, accurate and local data.
Register to attend this live virtual event here – https://bex-events.com/forecast/. Attendees will all receive access to the live virtual presentation, a PDF of the slide deck (new this year!), and a GrubHub credit for a meal the day of the event. Early bird pricing is in effect now; registration prices will increase after Friday, December 18th.