By Roland Murphy for AZBEX
The more important the topic being studied, the more important it becomes to look at multiple sources. It’s especially useful when those sources take different approaches to data collection and analysis.
ABI Multifamily dropped its Year End 2022 Phoenix Multifamily report toward the end of January, and Northmarq issued its Q4 2022 Market Insights report earlier this week.
In addition to using some common and some unique sources, the two reports cater to generally different data consumption preferences. ABI tends to go for a more tabular reporting format, appealing to the more number-centric. Northmarq’s presentation is more chart-heavy, thus appealing to more visual users.
To explain the different sources, ABI generally draws data from Yardi Matrix and internal data analysis. Northmarq relies on internal data, CoStar and Apartment Insights.
One caveat needs to be addressed even though it may not have a direct impact on reporting. While CoStar is the primary outlet for many brokerages’ multifamily market data, a situation from mid-2022 illustrates why brokerages, like reporters, sometimes encounter challenges when relying on a single source and why that practice is not recommended, no matter what the one source might be.
Speaking on background last July, a research official at one major brokerage explained difficulties they were having with CoStar data, saying the most recent market stats at the time were “insanely off.” The source said CoStar did not separate out projects under construction or in lease-up from occupancy numbers and factored in total deliveries for the rest of the year, treating them as vacant and leading to discrepancies.
Now that we have a couple of points to start from, let’s take a look at what happened at the end of the year that saw some major economic shifts, record-setting construction paces and the end of a market sector swell investors hoped would go on forever while tenants prayed for some relief.
What Did the Market Do?
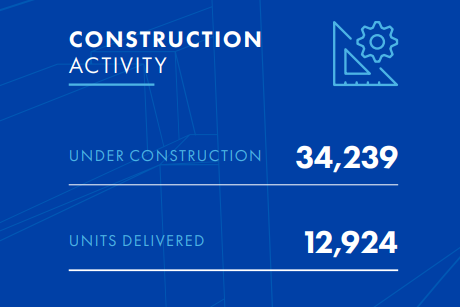
First, let’s start with the numbers. Northmarq reports 12,924 new units delivered in 2022 and another 34,239 under construction. ABI set the completion number at 11,985 with an under construction pipeline of 39,191.
Northmarq expects the market to deliver approximately 16,000 new units in 2023. ABI does not make a prediction, but it includes units planned, in addition to units under construction. ABI’s data shows a count of 29,788 units planned in Greater Phoenix, but not yet under construction.
ABI recorded the total sales volume for the year at $14.22B, a year-over-year drop of 16%, with an average price/unit of $315.6K and average price/SF of $376.20. Northmarq, meanwhile, reported a median price (not average) of $286.9K/unit and did not break out price/SF. The report does not include a total sales transaction amount.
It does, however, track sales activity levels, which ABI does not. For the full year, Northmarq reports transaction activity dropped 26%, with a 62% year-over-year decline for Q4.
Northmarq reported asking rents dropped 2.2% in Q4 but increased by 2% for the year. In the first half of the year, rents increased 4.9% but fell 2.7% in the second half. Northmarq’s Q4 asking rent was $1,616 in Q4.
ABI reported the year end asking rent at $1,691, which their data showed to be a 3.5% year-over-year increase.
Both houses reported interesting shifts in vacancy/occupancy rates. Northmarq publishes its data as a vacancy rate, which it put at 6.4% (93.6% occupancy) in Q4. It reported that vacancy went up 210 basis points for 2022, which marked the first Greater Phoenix vacancy increase since 2016.
ABI, meanwhile, reported an occupancy rate of 94.1% (5.9% vacancy). Their data showed this to be a 1.8% decrease year-over-year.
So, despite some apples and oranges reporting styles and different orientation mechanisms for different providers using different sources, we can generally take comfort that two of the major multifamily brokerages’ numbers are roughly in synch. Outliers are fascinating as an intellectual puzzle but troubling when one is trying to grasp what is actually going on in a crowded and complex field.
Conclusions
ABI Director of Research James W. Hall concludes the report and his detailed analysis by saying, “Our outlook for the Phoenix MSA remains optimistic, as strong demographic and fundamental trends continue to entice investor appetite. Sustained economic investment and development initiatives will continue to provide investment opportunities for all commercial real estate asset classes. The infrastructure bill outlines extensive transportation and logistic projects that will drive additional economic growth across the metro. High in-migration and massive new business developments, including the $40B TSMC project, will drive demand for housing, priming the multifamily market for sustainable future growth and expansion.”
Pete O’Neil is Northmarq’s director of research, and the report echoes many of Hall’s elements for ABI. “The pace of deliveries has trended higher in recent years but will likely peak in 2023 and 2024, causing supply-side pressures. While new projects will come online, the region’s long-term demand drivers are healthy, and new developments are located along the path of growth….
“The local investment market will likely take the first quarter or the first half of 2023 to adjust to the changing operational conditions and capital costs. Some of the transition began to take shape during the fourth quarter, when cap rates rose nearly 100 basis points from the preceding period. Transaction activity has been limited in recent months, and uncertainty about the prospects for a recession is expected to linger for at least the first few months of 2023, which could further restrict sales velocity. Following a year of rapid interest rate increases, there is not yet a consensus of where or when rates will level off in 2023. As the outlook for the debt markets becomes clearer, cap rate expectations for buyers and sellers will more closely align, and transaction activity will ultimately regain momentum.”

