
By: Thomas M. Brophy for Colliers International Multifamily Times
AZBEX Note: Thomas M. Brophy is National Director of Research & Analytics | Multifamily Investments for the Colliers Cooke Multifamily Team. This column was distributed March 18, and all data were considered current at that time. Even though it has been edited for length, you will notice it is appreciably longer than most of the content we run. This is, however, the most comprehensive, best-explained and best-sourced analysis of the current state of affairs out of the dozens we have seen so far and warrants an exception to our general policy of concision.
Multifamily Times is an internal publication (which we are releasing publicly given the seriousness of our time) meant to interpret, analyze and dissect the major economic news/market events and how they relate to the multifamily housing market. Our goal is to encourage discussion, creating a platform to work through ideas in the understanding that none of us have all the answers.
Our hope is that in the process of refining, arguing and questioning our own thoughts that not only will we find our individual voices, but our collective voice as well. In our new era of big data, we have reached peak data overload and our goal is to convert that data into wisdom.
Knowledge is a derivative of information; data without context is like a light without a bulb, a market without a narrative or an explanation without a common reference point. Data is but a guide to asking better questions; better questions lead to greater understanding, which, if deployed effectively and purposely, leads to better results.
Wisdom, knowledge’s ultimate abstract, can only be gained when tethered to, and guided by, past experience. The Colliers Cooke Multifamily Team has four senior brokers, three of whom that have over 35 years’ experience. Over that time, our brokers have not only lived through, but thrived, during several major market disruptions and have the proven wisdom and insight to navigate rapidly changing market conditions.
Our intent with Part 1 of our COVID-19 series is two-fold; one, to provide more context of current market conditions in that we need to understand, feel and recognize this pandemic’s extent so we can individually and collectively make the necessary steps forward that will lay the groundwork for our emergence from this crisis. Second, as the refinement process for discussing COVID-19s potential impacts on the overall economy and then focusing on more local market metrics.
While Part 1 focuses exclusively on the potential economic fallout, Part 2 will dive more into the potential disruption and opportunities that will arise over the course of this outbreak and our overcoming it, together.
Where to Begin?
The only way to begin is to have a sober assessment of where we are. The thing about most of our economic numbers is that by the time we observe, analyze and record them, the conditions have already changed.
For example, the virus’ migration to the US only manifested within the past week and therefore will not show up in data tables until the end of April and into May. Any understanding we derive must be continuously refined as new information becomes available, but Wisdom will prevail in not only dissecting the new information but in leading us into the new market conditions.
Just as minerals are forged under tremendous pressure and heat to yield their beauty; so too can our clear-headed response in exigent circumstances define ours. Part of that response, and what we’re addressing in this article is to attempt to measure national, and local, market’s potential contraction based on the extremely limited, government approved data coming out of China via their February numbers. Why base off China? Simply put, they were the first country engulfed in this pandemic and appear to be the first slowly emerging from it. Their trajectory has the potential to offer anecdotal evidence of what emerging trends to look for as we, ourselves, will begin to move forward in the coming weeks.
In regards to the economic outlook for China we must remember that the numbers are but one month’s worth of data only. And one month, nor two months, of data does NOT a trend make, especially given the extraordinary circumstances that we know occurred during those previous two months; from upward of 65M people put into active quarantine to enactment of strict social distancing. However, we must also be aware that since the beginning of March the infection rate in China, and elsewhere in the world, has been reducing and NOT continuing its exponential growth.
While it is still too early to claim that we have passed the inflection point, we are moving closer to a containment phase, at least as it looks right now. Nonetheless, the numbers that could potentially reflect that change will not be seen until sometime in May or June.
With that in mind, now let us look at China’s February numbers with as sober and rational mind as possible. Retail Sales contracted (20.5 percent) YTD YoY – the first annual drop on record and far greater than the (4.0 percent) contraction previously expected. Some of the bigger retail hits include restaurants and catering down (43.1 percent), clothing down (30.9 percent) and jewelry down (41.1 percent). Industrial Production contracted (13.5 percent) YTD YoY – the first annual drop on record and again came in higher than the expected (3.0 percent) contraction amount. Fixed Asset Investment down (24.5 percent) YTD YoY – its first annual drop and above the expected (2.0 percent) contraction. Property Investment down (16.3 percent) YTD YoY and, finally, the Jobless Rate rose nearly 120bps to 6.2 percent.
A National Look
In working out how best to calculate our current contraction, we looked to the ‘food services and drinking places’ sector to not only serve as a guide for an industry closest to the “eye of the economic/social storm,” but also to help give perspective of the markets overall, temporary contraction.
For the Phoenix MSA, as of December 2019 over-the-year sales for the industry was just above $1B. For brevity, we took the total and divided by 12 to get an average monthly sales rate of approximately $100M. Furthermore, we assumed that the months of March and April 2020 would be peak contraction months with a gradual return to the average by July 2020. Assuming peak contraction amounts between 30-50 percent range in monthly sales yields a more generalized (10 percent) over-the-year contraction to approximately $900M in total sales by December 2020.
Lastly, we then took this (10 percent) over-the-year contraction metric and applied it to the GDP/Production/Output numbers as a whole, knowing that not all industries are going to be impacted in the same way and that this analysis is only meant to be a rough estimate.
Industrial Production Index: The industrial production index measures real output across three sectors: manufacturing, mining and electric & gas utilities. The index is measured in real terms with 2012 as the base year. In January the index was 109.20, down (0.34 percent) from the prior month, and (0.92 percent) over-the-year. Based on a contraction rate of (10 percent), if the U.S. were to see this drop the index would drop to 98.3 which would be 11 percent higher than the trough during the Great Recession (87.07 in June 2009).
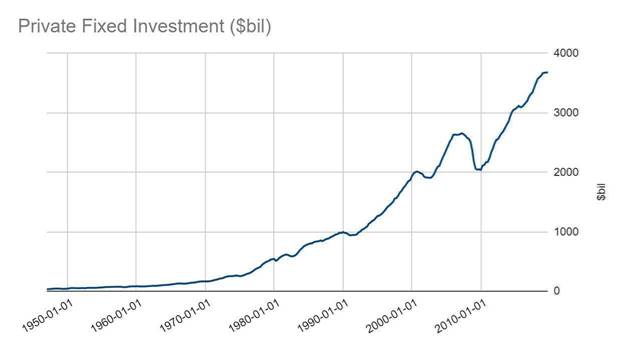
U.S. Fixed Private Investment: Fixed private investment, displayed below as the annual rate in billions of dollars, measures commercial and household spending on capital that is used in the production of goods and services. It is viewed as a measure of firms’ eagerness to invest in their productive capacity through the acquisition of new equipment and replacement of existing or worn out equipment. Total investment was $3.7T as of Q4 2019, a drop of (10 percent), would reduce this rate to $3.3T, in other words, back to the levels seen in 2016/17, but nowhere near as low as the Great Recession’s trough in Q1 2010 of $2.04T.
U.S. Retail Sales – U.S. Retail Sales, Advance Retail Sales: Retail and Food Services Total reached $529.8B in January 2020. This was up $1.4B from the previous month and $22.2B from a year ago. A (10 percent) drop in retail sales would be a return to late 2014 levels, yet still not as low as the Great Recession trough of $329.7B in March 2009.
Phoenix MSA
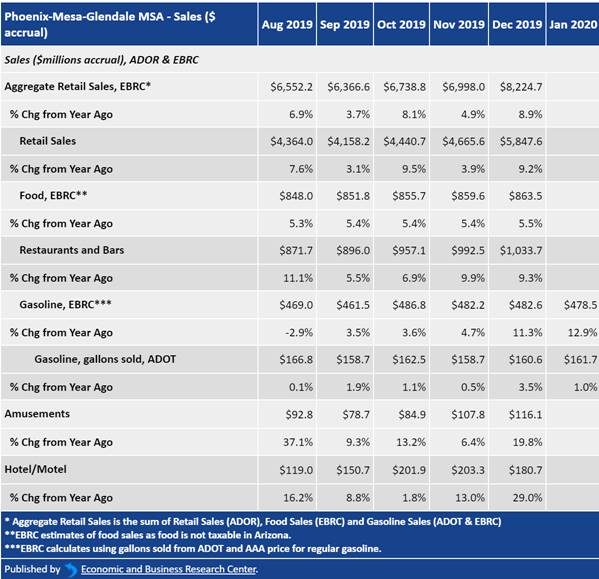
More locally, specifically at the Phoenix MSA level, retail sales were $5.85B as of December 2019. In Maricopa County, alone, nearly 235,000 people are employed in the retail trade which equates to nearly $25K of total sales per employee. Assuming a (10 percent) contraction would reduce overall sales by nearly $600M to $5.65B in total, or a reduction of $2,550 in overall sales per employee.
From a Phoenix MSA GDP perspective, when chained to 2012 Dollars, a (10 percent) contraction would effectively reduce our output to 2015 levels. Helpful to note, 2015 marked the year when the Phoenix area began its rapid growth trajectory, averaging 63,000+ over-the-year job growth and taking the nation’s top spot in population growth.
It’s 5 O’clock Somewhere
At this point, COVID-19’s potential impact on both the real estate industry, and market overall, remains to be seen. As is the case with these types of exigent circumstances, solid data sets remain elusive in light of what we truly need answered.
While we do not have firm data as to the full extent of this disruption, make no mistake that its impact will be significant, although not expected to be long term. While both the Federal Reserve and Federal Government have continued to proactively pursue all economic maintenance measures — from reduction of interest rates to 0 percent, as well as the full resumption of Quantitative Easing and capital injections into the Repo market — should keep liquidity levels high, which bodes well for real estate. Liquidity is a major factor in overall real estate transactions and the market, with Central Bank backing, has continued to remain extremely liquid.
Currently markets, in their customary way, have violently de-risked in the face of infinite uncertainty, with the Dow volleying between gains and losses; the penultimate result bringing an end to the longest bull run in our nation’s history.
But all is not lost. China and South Korea, and to a lesser extent Singapore, are all showing infection bell curve reductions and would seem the initial wave of infections in those areas are decreasing. Nonetheless, we must understand that our own virus numbers will increase before they get better, but as more tests, and testing locations, come online, we will finally get better, more reliable numbers.
Once we can truly measure the extent of the virus’ actual effect on the population, and not just conjecture, our quest for a solution will become clearer. In these turbulent times, what we say and do matters. We are all in this together. And we will all rise from this together.

NEWS TICKER
- [August 25, 2026] - Arizona Construction Employment Slips in July
- [August 25, 2026] - Mesa Planning and Zoning Board Recommends Approval of Hawes Crossing Mixed-Use District
- [August 25, 2026] - Two-Year Water Plan is Official, Lower Basin to Receive Cuts
- [August 25, 2026] - Industry Professionals 08-25-26
- [August 25, 2026] - Commercial Real Estate 08-25-26
- [August 21, 2026] - New Self-Storage and RV Development Planned in Pinal
- [August 21, 2026] - Maricopa May See New Mountainside Fitness
- [August 21, 2026] - ACC Updates Large-Load Customer Service Agreement Policy
Credit: Colliers International