By Roland Murphy for AZBEX – BEXCLUSIVE
Anyone who has ever taken an intro to economics course while also trying to navigate the real world knows basic principles become guidelines, at best, when confronted with the subtle variables of daily life and macro markets.
In terms of base operations, the relationship between supply and demand and the impact on a given item or commodity is easy to grasp and is a primary reason intro to econ is a common elective for many students. If supply exceeds demand, prices drop. If demand exceeds supply, prices rise.
That’s certainly not a bad way to bet when markets operate rationally. It’s when things become irrational—as in the rental housing market over the last five years—that economists who stayed in the program beyond the 500-level classes really earn their money.
Here’s a quick primer for people who have been vacationing off the face of the Earth for a while: Owners and developers spent a couple of decades not building enough apartments to meet demand. This provided for steady, though generally not exorbitant rent growth. Demand exploded over the last several years as populations shifted, demographics changed, the economy ran far afield in several different ways, a global pandemic upended every aspect of life and markets, and rent increases soared into territory that no one could have predicted.
In some markets, like Phoenix, median rent growth increased by more than 45% during some sample periods.
This, of course, has led to a boom in apartment development. After years of under-building, developers eager to capitalize on that repressed demand and those soaring rates pulled out all the stops and started building at a rate not seen in more than 40 years. Almost all these properties, both in Phoenix and nationwide, were top-tier developments.
Along with the new building boom, investors started buying older, less desirable properties and investing in upgrades. These once run-of-the-mill apartments got new signage, upgraded landscaping, interior features and functional improvements and nicer amenities, followed by rent increases that put them on par, or very nearly so, with new developments.
Even old communities that saw no renovation or reinvestment saw rents increase as demand pressures continued unabated for an extended period. It was classic supply and demand on steroids.
Rent Growth Drives Construction and Deliveries
Rents exploded beyond the realm of even conceptual affordability. Growth markets like Phoenix, with its exceptional rate of in-migration and previous perception as an affordable market, saw median rents go up as much as 45% in some sample quarters.
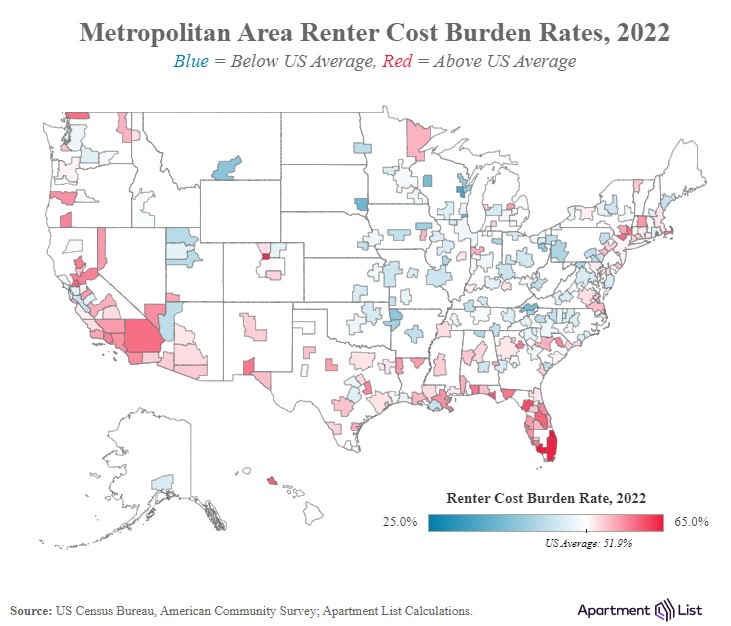
As a result of the explosive growth, the percentage of households that are considered “cost burdened” has risen dramatically. According to recent data from the U.S. Census Bureau and compiled by Apartment List, “The share of renters who are moderately cost-burdened – those spending between 30 and 50 percent of household income on rent – has risen slightly, from 24.7% in 2019 to 25.2% in 2022. Unfortunately, most of the recent increase has come from severely burdened households who struggle most acutely with their housing costs. The share of severely burdened renter households increased from 23.7% to 26.7% from 2019 to 2022.”
The national average cost burden rate is 51.9%. Metro Phoenix is higher, reporting a rate of 53.9%.
Market economists whose work stems from historical review and analysis (as opposed to those who rely more heavily on theoretical modeling) began pointing out the only way to adequately address affordability was to increase supply, and to do so at all price points.
Arizona economist Elliot D. Pollack has been something of an evangelist on the issue. Commissioned to study the issue for housing advocacy group Home Arizona, Pollack reported three key findings: Metro Phoenix has a severe housing shortage, adding supply is the only solution, and failing to add the necessary supply will add to housing costs of all types.
The market and developers responded, not out of any sense of altruism and compulsion to improve affordability, but rather out of a drive to capitalize on those rising rents and earn a larger portion of the returns multifamily was generating. That’s how a free market system works.
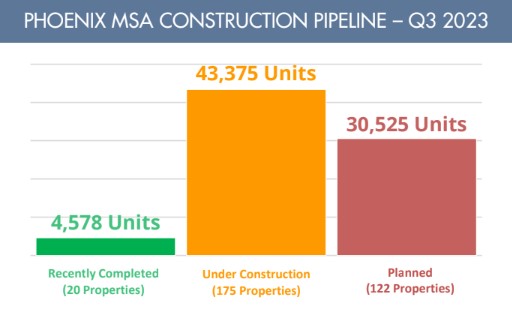
Multi-housing News reported 433,838 units delivered in the U.S. in 2021. Due to a host of issues, including drastically increased interest rates, 2022 deliveries dropped to 348,714. For comparison, 2019 deliveries were 276,600.
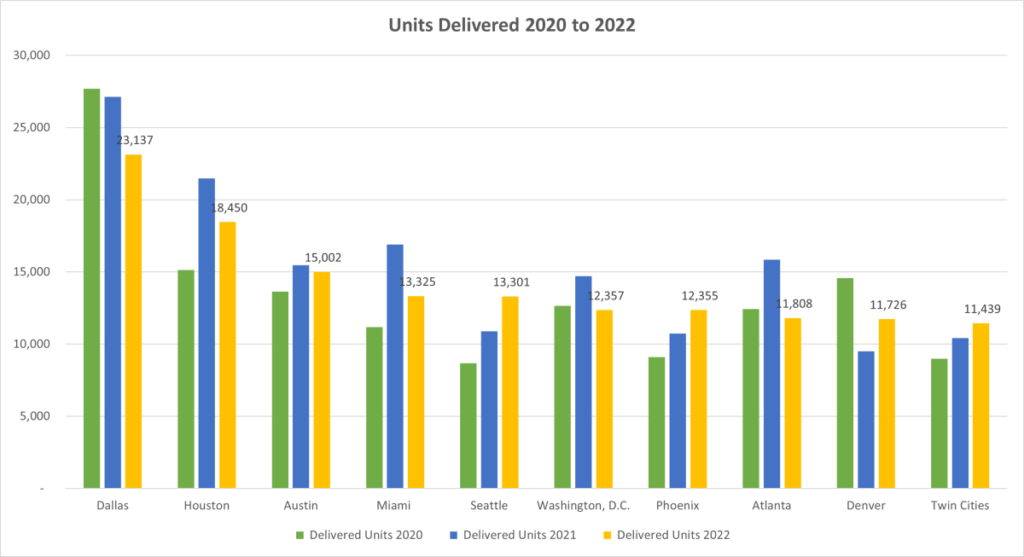
As a result, according to the latest research from ABI Multifamily, metro Phoenix currently has more than 43,300 units under construction across 175 properties and another 30,500 planned in 122 properties. Nationally, there are more than 1 million units under construction, according to Institutional Property Advisors’ Sept. 2023 report.
New Deliveries Improve Affordability
While rarely making for a textbook-level neat and clean graph, markets really are cyclical. In the simplest terms, underbuilding led to demand, which reduced affordability but accelerated construction, which led to new deliveries.
With those new deliveries coming online, there is now a softening in demand, although it is markedly less than many analysts were predicting 18 months ago. What is most interesting is the effect those deliveries are having on so-called “down market” properties.
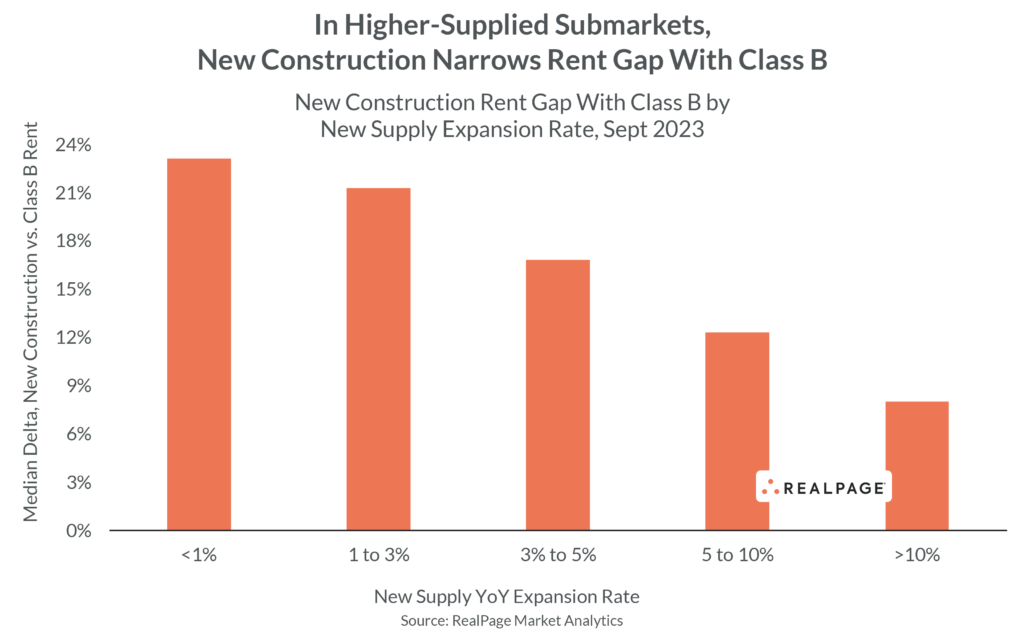
Writing this week in GlobeSt.com, RealPage Senior VP and Chief Economist Jay Parsons reported the apartment construction boom, most of which is happening at the “Class A” level, is having interesting effects on rents at the Class B and Class C levels. He said, “The surge in apartment construction is softening the Class B market more than any other asset class. In high-supply submarkets, Class B rents fell more than twice as much as Class A over the past year. Yet in submarkets with no new supply, Class B performed right in line with Class A.”
Since the abundance of deliveries has begun—but only begun—to satisfy demand, rent growth and occupancy have cooled. As a result, owners have begun putting in place incentives such as a couple of months’ free rent to make their units more attractive.
This has allowed the once fundamental practice of moving up to resume in some markets. The core principle is that when top-tier apartments become more affordable and available, more prosperous renters in lower level apartments will move up to newer, bigger or better apartments, creating vacancies in their previous apartments and allowing the level below them to move up as well.
Parsons is surprised, however, that Class B is softening more than other asset classes. He said, “In high-supply submarkets, Class B rents fell more than twice as much as Class A over the past year. Yet in submarkets with no new supply, Class B performed right in line with Class A.
“It’s all about supply. The more supply in a submarket, the more likely rents are falling in ALL asset classes. But surprisingly, the biggest impact is on Class B,” according to RealPage data.
“In submarkets expanding their apartment count by more than 10% over the year-ending September 2023, effective rents in Class B fell 3.7%. By comparison, rents in those areas dropped 1.5% in Class A and 0.8% in Class C. And in submarkets expanding their supply by 5-10%, rents fell 2% in Class B compared to 0.6% in Class A and 1.5% in Class C.”
Class B rents in Phoenix dropped 6.7%.
Parsons goes on to say, “For Class B operators, this is an unpleasant surprise turn. “Flight to quality” is playing out more than it did in past cycles among mid- and upper-income renters.
“For renters, it’s more evidence that the balance of power has shifted back to renters.
“And for policymakers, it’s a powerful sign that if you truly care about housing affordability and access, it starts by legalizing and approving A LOT more housing.”
While I certainly agree there needs to be much more housing approved across the Arizona and national markets, I, for one, am not particularly surprised to see Class B apartments showing the most softening. For one thing, Class B properties were the ones more heavily targeted for refurbishing and improvements during the boom. Many of them were improved to the point that they crossed the threshold into Class A, both in terms of actual features and in terms of rent rates.
This reduced the volume of available Class B units since there was little-to-no new development in that space. I suspect, however, that reduction turned out to be somewhat artificial, or, at the very least, limited. While improved Class B units may have “passed” for Class A in terms of marketing in the early stages of the boom, the deluge of “real” Class A units coming online has likely pushed those refurbished units back down the ladder a bit in terms of pricing.
The value goes up on your 2013 BMW 5-series if you invest in repainting, a new interior, an improved sound system and other features, but even though it is worth more than a non-reconditioned 2013, it loses comparative value when a huge new shipment of 2024 7-series hits the lots, particularly when there are financing incentives on the new cars.
Can the Cycle Even Out?
The upside is that affordability has improved, as have renter options. The downside is that both construction starts have slowed due to high construction capital costs and a worry about “oversupply” among developers and investors.
I put oversupply in quotes because it’s an exceptionally relative term. The demand is still there, at least at red hot if not the previous white hot levels, but it is not high enough to keep rent growth from moderating and even flattening in some areas. When a market has gotten used to seeing massive returns, normalization can seem like collapse. Even though the market has ramped up considerably and delivered enough units to start making an impact, it is still not keeping pace with demand and backlog.
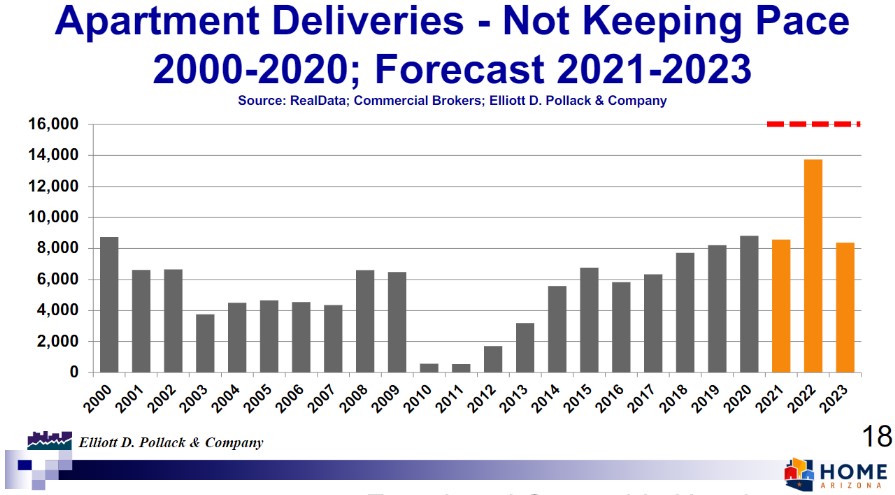
According to IPA, “Apartment construction starts in the 15-market core building locations skidded to 30,800 units in the second quarter of 2023. That start volume is off 52% from the quarterly norm of 64,200 that was sustained for nine quarters from early 2021 through early 2023. Absolute peak quarterly starts totaled 81,500 units from April through June 2022.”
Due in large part to its continued in-migration levels, Phoenix has not fallen quite as far as the national average. Q2 starts in Phoenix have only fallen 43%.
Based on all the multifamily market and development data, here is my most optimistic scenario: Assuming the economy does not take any fresh new major hits, we will continue to see starts drop until rent growth begins to nudge back up. Then, hopefully, we may see this flailing of weaving way too far from one side of the road to the other begin to abate, with a more steady balance of development and construction to accommodate a more steady volume of renters across market classes.
Given that renters often need to make decisions about their living circumstances on an annual basis, and given that investors and financiers have to make guesses with multi-year effects based on shorter-term data, there’s no telling when, or if, that equilibrium might happen, but the entire market should keep it in mind as a mid- and long-term goal.

